Smart Utilities6 min read
A step towards the identification, analysis and rectification of system loss, network health and revenue protection.

Randhir Kumar Verma, PMP®
Published 21 Sept 2026
From Data to Action: How We Trained 150+ NBPDCL Officials to Find, Fix and Protect Every Unit
Executive Summary
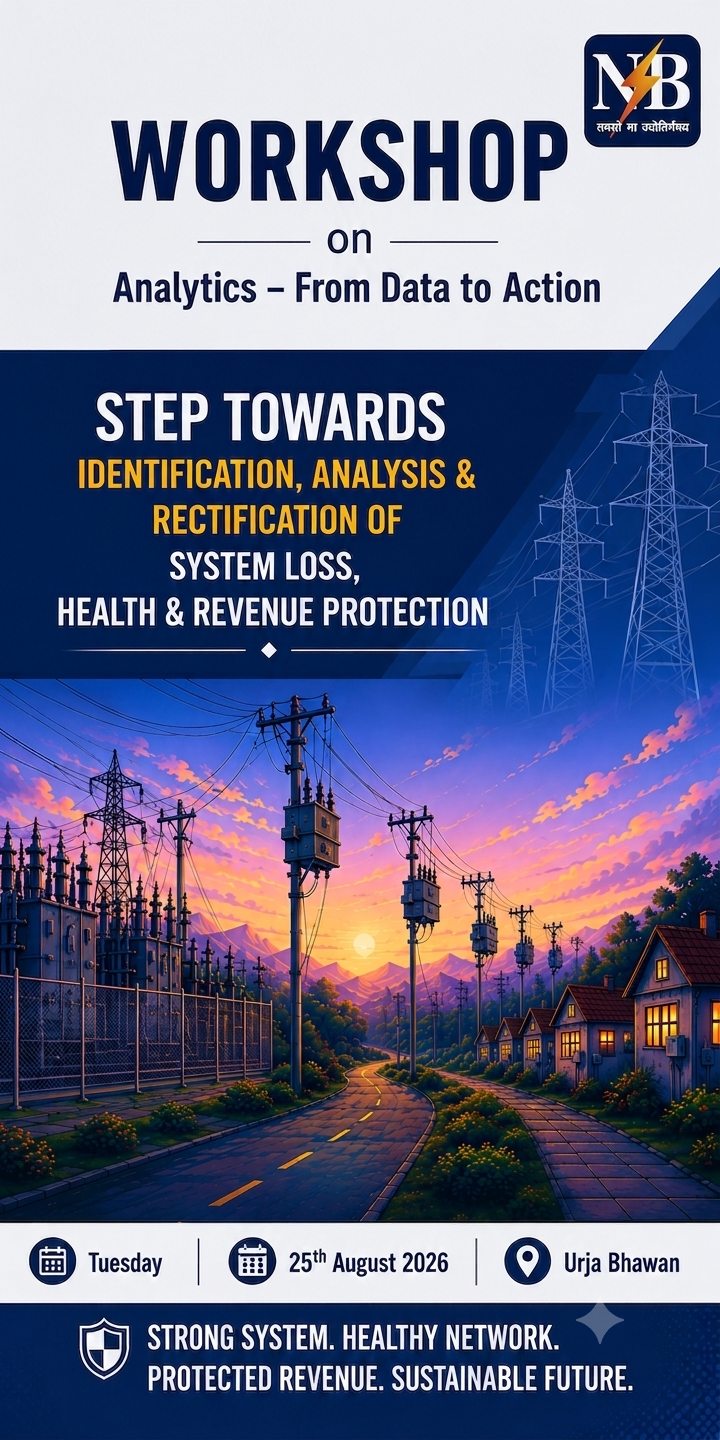
On Tuesday, 25 August 2026, we brought together more than 150 officials of North Bihar Power Distribution Company Limited (NBPDCL) at Urja Bhawan for a workshop titled "Analytics – From Data to Action." The participants were SDOs, JEs, AEEs, EEs and the AMISP team.
The theme was deliberate: a step towards the identification, analysis and rectification of system loss, network health and revenue protection.
We didn't run this as a presentation on dashboards. We ran it as a train-the-trainer programme. The goal was that every officer in the room would go back to their division and teach their own teams how to read the data, act on it and close the loop.
The mandate going forward is clear: data-led inspection drives, backed by weekly and monthly reviews.
Why This Workshop, and Why Now
Smart metering has changed what a DISCOM can see. Every consumer meter, every distribution transformer (DT) meter and every feeder meter now reports energy, load, voltage and events. On the Genus AMISP dashboard, that information is available down to the individual consumer.
But visibility is not the same as action.
In my experience, the biggest gap in a smart metering programme is not technology. It's the distance between the dashboard at headquarters and the decision a JE makes on the ground. A loss hotspot that nobody inspects is just a coloured cell on a screen.
This workshop was built to close that distance.
The Framework: Identify → Analyse → Rectify
We structured the day around one simple loop, applied to three outcomes: system loss, network health and revenue protection.
| Stage | The question we ask | What the data tells us | What the field does |
|---|---|---|---|
| Identify | Where is energy going missing? | Feeder and DT energy accounting: input energy against billed energy | Rank feeders and DTs by loss and pick where to act first |
| Analyse | Why is it going missing? | Tamper events, non-communicating meters, zero or abnormal consumption, load-profile breaks, consumer–DT mapping errors | Separate technical loss, data or mapping issues and commercial loss |
| Rectify | How do we fix it and prove it? | Before-and-after consumption and loss trend on the same DT or feeder | Run the inspection, take corrective action, regularise or bill, and track the recovery |
The key message to every officer was this: the data points are not reports. They are leads. Each event, each abnormal load profile and each mismatch between a DT and its consumers is a question that deserves a visit.
The Data Points That Matter
A large part of the day went into showing why specific data points matter. When officers understand the reason behind a number, they start trusting it and using it.
- Energy accounting at feeder and DT level. This is the foundation. If the consumer-to-DT mapping is wrong, the loss figure is wrong. So fixing indexing is the first loss-reduction activity, not an IT chore.
- Tamper and event logs. Events like cover open, magnetic interference and neutral disturbance point directly to where an inspection team should go.
- Non-communicating meters. A meter that doesn't report is a blind spot. Tracking communication health is part of revenue protection.
- Consumption patterns. Sudden drops, long periods of zero consumption and patterns that don't match the connected load are strong signals for inspection.
- Network health indicators. DT loading, voltage behaviour and interruptions help prevent failures and protect both the network and the consumer.
Train the Trainer: Designed to Scale
A single workshop in Patna can't reach every section office in North Bihar. So we designed the day as a cascade.
- Master trainers at the workshop learned the method, the dashboard and the field playbook.
- Each trainer goes back to their division or sub-division and trains their own JEs, linemen and field staff.
- Field teams apply it through targeted inspections driven by data.
- Results flow back up through the review cadence, so the method keeps improving.
This is how analytics stops being the job of a small central team and becomes the way the whole organisation works.
From the Workshop Hall to the Field
A workshop only matters if something changes on Monday morning. We agreed on two operating mechanisms.
1. Data-driven inspection drives. Inspections are now planned from the dashboard, not from habit. High-loss feeders and DTs, tamper events and abnormal consumers form the inspection list. Every inspection records an outcome.
2. Weekly and monthly reviews.
- Weekly reviews at the operational level track inspection progress, communication health and the status of each flagged case.
- Monthly reviews at the leadership level track loss trends, revenue recovered and network health by circle and division.
This review rhythm is what turns a one-day training into a lasting habit.
The People Who Made It Happen
The workshop was led by Mr. Vinay & Other Utility Officials. It was delivered by Mr. Randhir Verma, Mr. Karan, Mr. Dayanand, other utility officials and me, with active participation from the AMISP team.
What stood out to me was the energy in the room. Field officers asked sharp, practical questions about specific feeders, event types and inspection priorities. That is the mindset change we were aiming for: from "What does the report say?" to "What should I do about it today?"
What This Means for Utility Leaders
If you lead a DISCOM that is rolling out smart meters, here's what I would take from this experience:
- Invest in people as much as in meters. Data only creates value when the field knows how to act on it.
- Use a train-the-trainer model. It is the fastest way to scale capability across a large, spread-out organisation.
- Treat data quality as a loss-reduction activity. Correct consumer–DT mapping before trusting any loss figure.
- Make inspections data-driven and outcome-tracked. Every lead should end with a recorded result.
- Institutionalise the review rhythm. Weekly for operations, monthly for leadership, with the same data on both tables.
Key Takeaways
- 150+ NBPDCL officials (SDOs, JEs, AEEs, EEs and the AMISP team) were trained at Urja Bhawan on 25 August 2026.
- The framework is Identify → Analyse → Rectify, applied to system loss, network health and revenue protection.
- A train-the-trainer model carries the method from Patna to every field office.
- The operating mechanisms are data-driven inspection drives plus weekly and monthly reviews.
- Data is a lead, not a report. Every data point should end in a field decision.
Strong System. Healthy Network. Protected Revenue. Sustainable Future.
Randhir Verma is an enterprise leader in digital transformation and smart metering, working with utility platforms at the scale of millions of endpoints. The views here are personal.
Related articles
Comments
No comments yet. Be the first to share a thought.